รายได้
Revenue analytics
Occupancy, ADR, RevPAR, daily trends and the source/channel/company mix for any window of nights — and the page where every metric in this section is defined.
อัปเดตล่าสุด
Who this is for: Manager, Owner, Read-only — requires
rms.analytics.read. Where: Dashboard → Performance tab
This is the Performance tab of the Dashboard — the property's revenue report for a window of nights: occupancy, ADR and RevPAR, four other revenue lines beside them, a daily trend for the headline numbers, and the mix of sources, channels or billing companies that produced them. The Dashboard is where every account with rms.analytics.read lands after sign-in; see reading your dashboard for how this tab relates to the Dashboard's other one, Operations.
It is also where the metrics are defined. Every other page in this section uses these words and links back here rather than redefining them, so there is one place to correct if your house counts something differently.
หมายเหตุ
This screen used to live at
/rms/analytics, one item deep inside the Revenue menu. Old links still resolve — they redirect here.
Read the window's headline metrics#
- Set From to the first night you want counted.
- Set To to the night after the last one — the window runs up to, but does not include, this date.
- Read the eight cards: occupancy, ADR, RevPAR, room revenue, room-nights sold, F&B revenue, MOD revenue, and total revenue.
The window opens on today through today plus thirty nights. Every figure on the page recomputes as soon as either date changes; nothing is cached overnight.
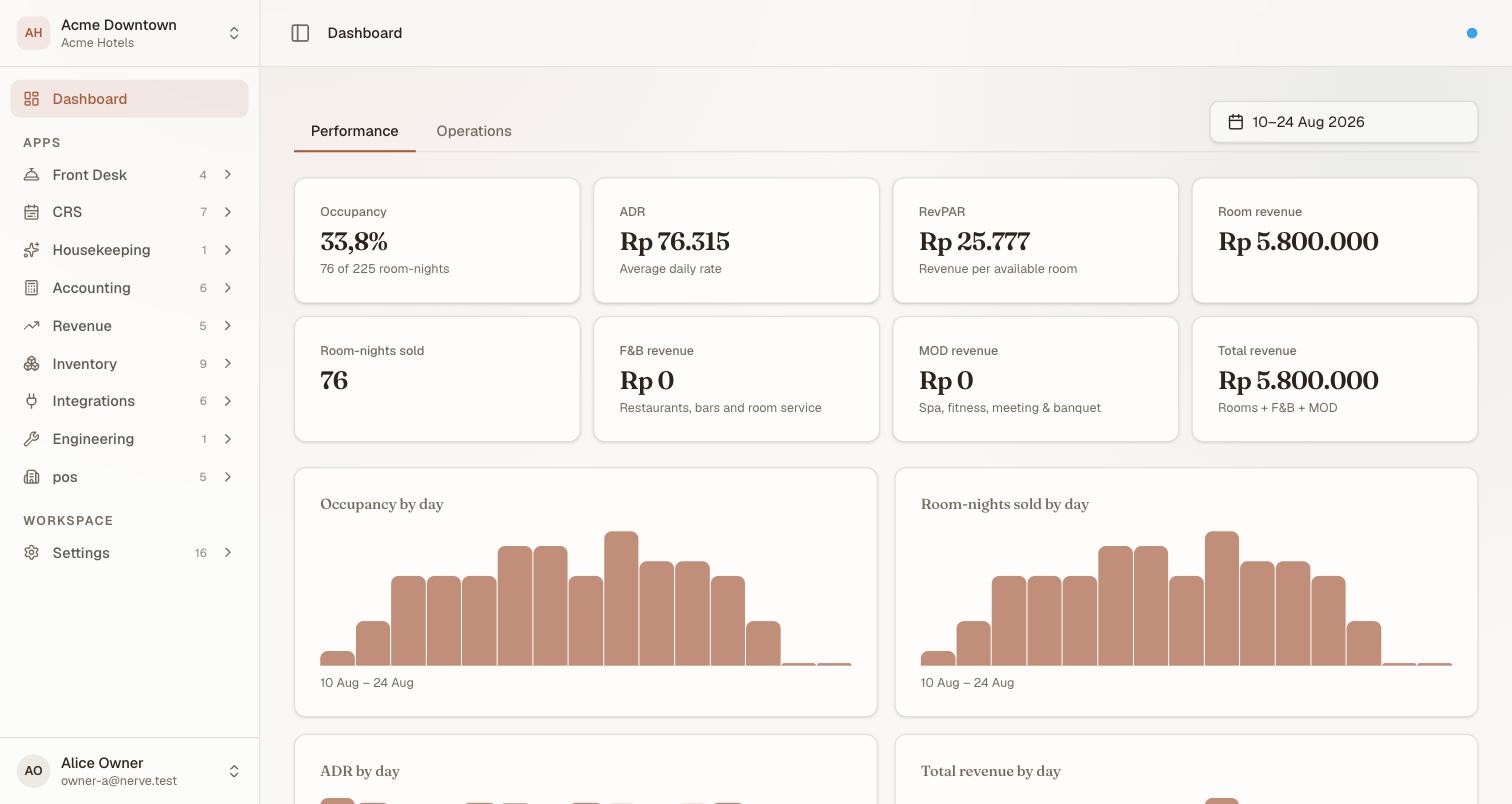
Eight cards, one window. Occupancy's sub-line carries the capacity fact — 76 of 225 room-nights — rather than giving capacity a card of its own.
Capacity is not its own card. It is the occupancy denominator, and it appears in the occupancy card's sub-line (sold of available) rather than as a separate headline number.
Know what each metric means#
These are the definitions the whole section runs on.
| Metric | What it is | How Nerve computes it |
|---|---|---|
| Capacity | Sellable rooms at the property | Every room on file for the property |
| Available room-nights | The denominator for occupancy and RevPAR | Capacity × nights in the window |
| Room-nights sold | The nights actually booked in the window | Each non-cancelled booking's nights that fall inside the window |
| Room revenue | Accommodation revenue for those nights | Each booking's total spread evenly across its own stay, then the nights inside the window added up |
| Occupancy | How full you are | Room-nights sold ÷ available room-nights |
| ADR | Average daily rate | Room revenue ÷ room-nights sold |
| RevPAR | Revenue per available room | Room revenue ÷ available room-nights |
| F&B revenue | Point of Sale food-and-beverage revenue for the window | Summed independently of room revenue |
| MOD revenue | Point of Sale revenue outside F&B (spa, minibar, and similar) | Summed independently of room revenue |
| Total revenue | Everything above, combined | Room + F&B + MOD |
Four consequences of those definitions are worth knowing before you argue with a number:
- A night belongs to the date it starts. A stay arriving on the 30th and leaving on the 2nd contributes one night to a window that ends on the 1st, not three.
- Capacity is every room on file. A room out of service still counts as available room-nights, so taking rooms out for refurbishment lowers occupancy rather than shrinking the denominator. If that is not how your house reports it, say so before comparing these figures with a board pack.
- Room revenue is accommodation only. F&B and MOD are counted, but separately — they never inflate ADR or RevPAR, which stay accommodation-only ratios.
- A cancelled booking is gone, immediately. There is no "as at" snapshot here — the report always answers as of right now. To ask what the book looked like at a point in the past, use the pace and pickup view on forecast and pace.
หมายเหตุ
Occupancy, ADR and RevPAR can each be renamed for your house under Settings → White-label. The cards will use your words; the arithmetic above does not change.
Read the daily trend#
Below the cards, four bar charts — occupancy, room-nights sold, ADR and total revenue — show one bar per night in the window.
These charts read from the same underlying series the cards above are computed from, so the bars always sum to the headline number rather than merely agreeing with it by coincidence. A spike or a gap in one is the first place to look before treating a headline number as a surprise.
Read the segmentation table#
Below the charts, a table breaks the same room-nights and revenue down along one of three axes — select which with the buttons above the table:
| Axis | Rows |
|---|---|
| Source | One row per connected channel, plus Direct for the booking widget and anything entered by hand |
| Channel | The same booking set, grouped by channel rather than by source category |
| Company | The company a stay is billed to, for corporate and group business |
Each row carries its own room-nights, its share of the total, its own ADR and its revenue — all three axes arrive in the same payload, so switching between them is instant and none can disagree with another about the window's total.
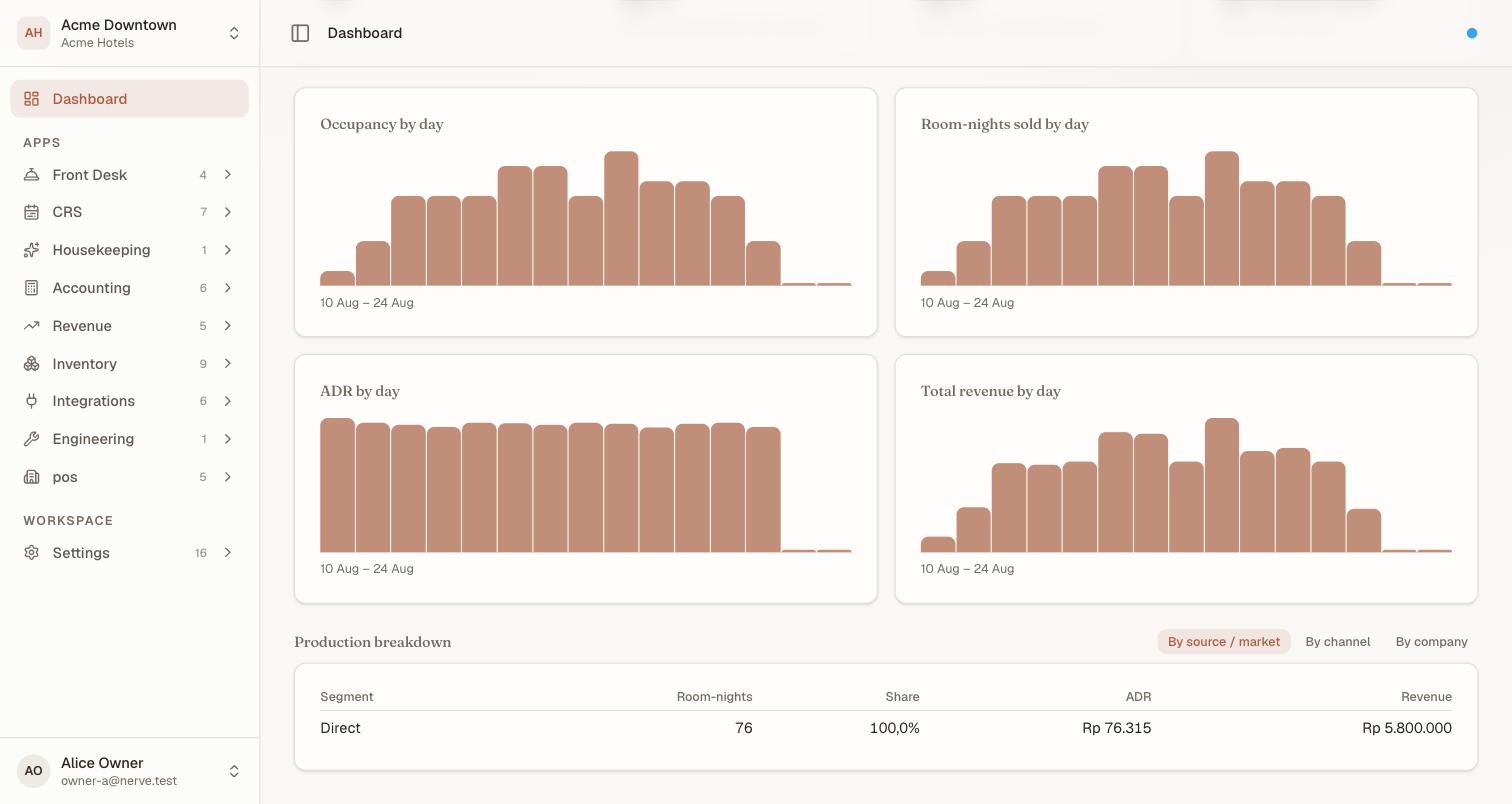
A property selling only direct shows one segment row at 100% — that is a correct reading, not an empty one. Connect a channel and its own row appears beside Direct.
That per-row ADR is the useful part on the Source axis in particular — a channel that brings volume at a materially lower ADR is a distribution decision, not a revenue-management one, and it is answered in connecting a channel.
A window with no bookings shows no segments at all rather than a row of zeroes.
หมายเหตุ
Rate parity is not on this screen. A card comparing each rate plan's intended price against what each channel was last told used to sit at the foot of this page. It is not part of the current Dashboard — the underlying check still runs server-side (
GET /rms/parity), but there is no screen that renders it today.
What's next#
- Forecast and pace — the same book seen forwards
- Grain and variance — the same book pivoted by segment, room category or booking window
- Workspaces, organisations and properties — these figures for every property at once, on the portfolio home you land on at sign-in
- Reading your dashboard — how this tab sits beside Operations